



Use to summarize this article


- A page passes Core Web Vitals when LCP is 2.5 s or less, INP is 200 ms or less and CLS is 0.1 or less for 75% of real visits.
- Real visitor data decides, not the PageSpeed score. A page can score 90+ and still fail the assessment.
- On B2B SaaS sites, the usual problems are the chat widget, HubSpot forms, Tag Manager, cookie banner, G2 badges and hero video.
- You rarely need to remove a tool. Change when it loads and how much space it takes.
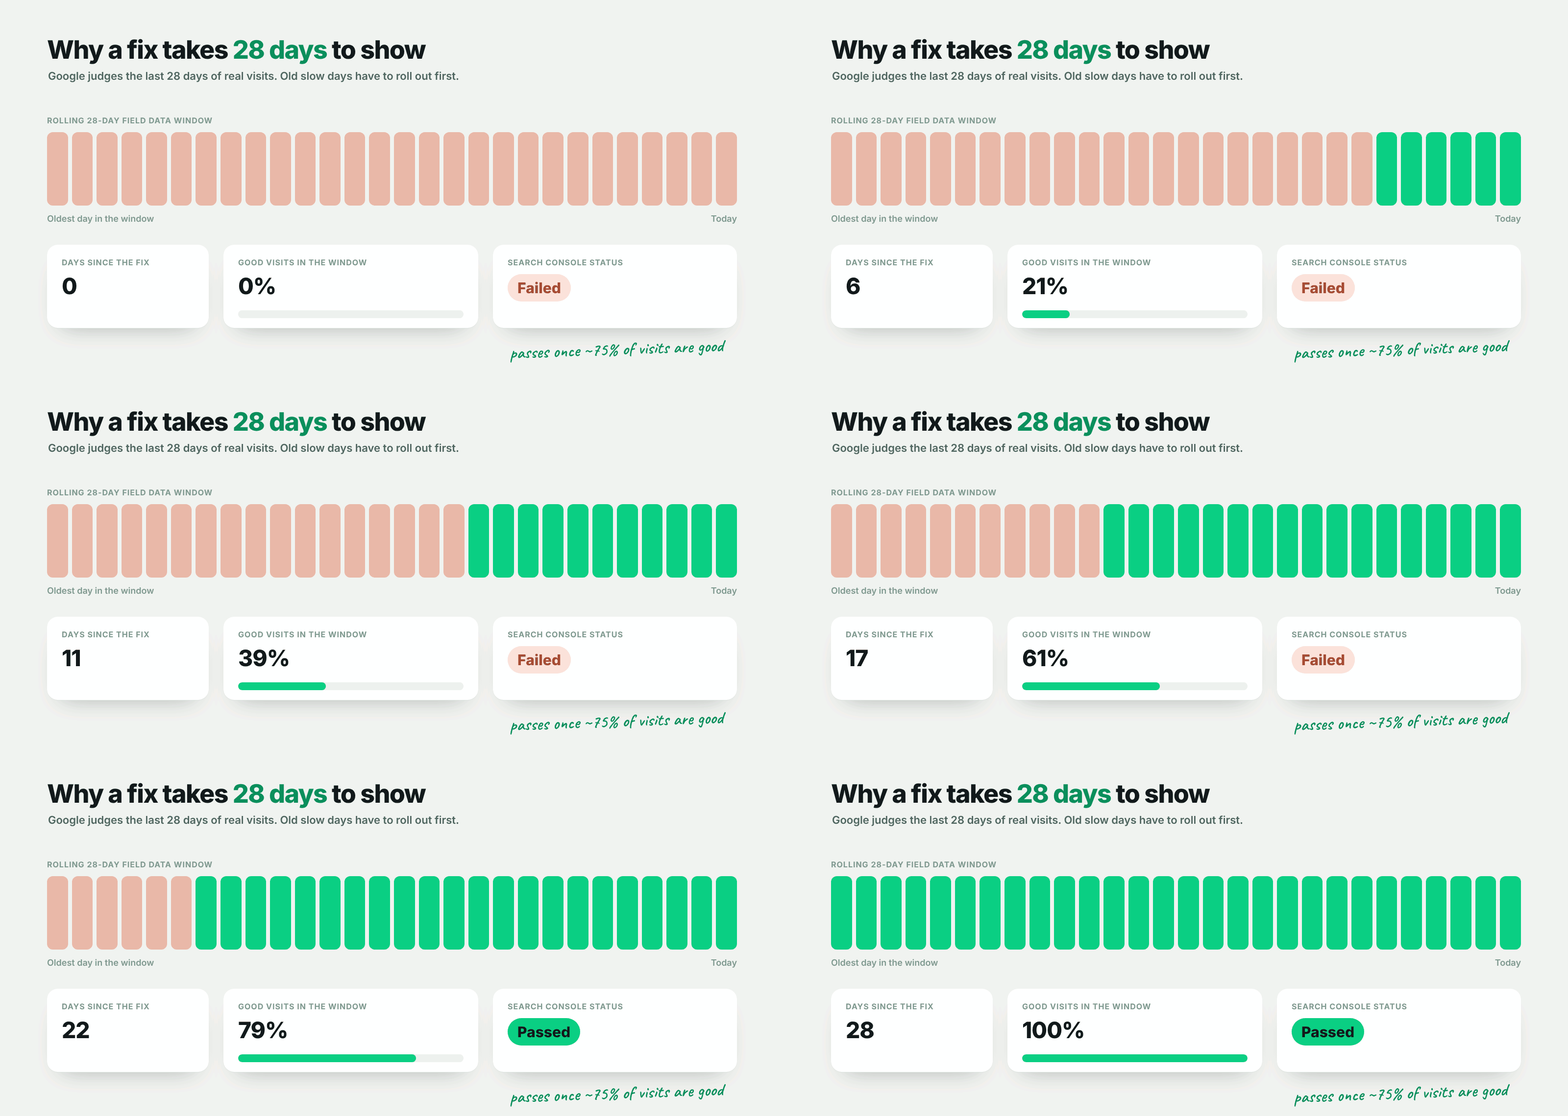
- Fixes take up to 28 days to show, because Google looks at a rolling window of real visits.
- Flowtrix builds Core Web Vitals into launch QA on every website, from ZingHR's 22+ page rebuild to PuppyDog's, where faster pages came with 30% more lead conversions.
If you want to know how to improve Core Web Vitals on a B2B SaaS website, start with what your team added to it, not with the code. On most B2B sites, the slow parts are the tools marketing installed over time: the chat widget, the HubSpot form, the cookie banner, a G2 badge and a long list of tags in Tag Manager.
Each tool makes sense on its own. Together, they push the page past Google's limits and turn the PageSpeed report red.
This guide goes through that stack tool by tool. You will see which Core Web Vital each one breaks, how to fix it without removing the tool, and how to pass the Core Web Vitals assessment and keep passing after your next redesign.
What Are Core Web Vitals, in Simple Words?
Core Web Vitals are three Google metrics that measure how a page feels to real visitors: how fast the main content shows up, how quickly the page reacts to a click, and how much the layout jumps around while it loads.
| Metric | What it measures | Good | Poor |
|---|---|---|---|
| LCP (Largest Contentful Paint) | How long the biggest element above the fold takes to show | 2.5 s or less | Over 4 s |
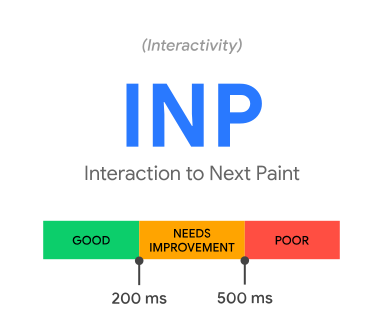
| INP (Interaction to Next Paint) | How long the page takes to respond to clicks, taps and key presses | 200 ms or less | Over 500 ms |
| CLS (Cumulative Layout Shift) | How much the content moves around unexpectedly | 0.1 or less | Over 0.25 |
Google judges each metric at the 75th percentile of real visits, with mobile and desktop counted separately. In plain terms, a page passes when at least 3 out of 4 visits get a good experience on all three metrics. INP replaced the older First Input Delay metric in March 2024, so any guide that still talks about FID is out of date.
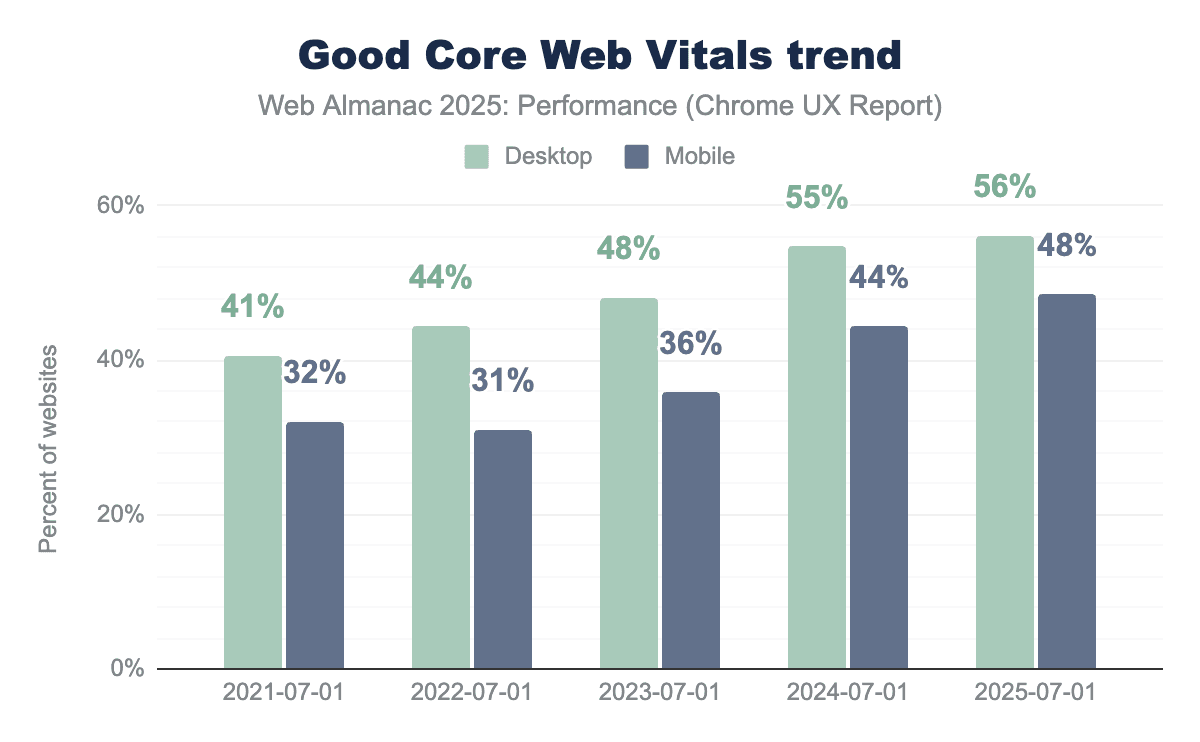
Most websites do not pass. The 2025 Web Almanac found that only 48% of mobile websites and 56% of desktop websites had good Core Web Vitals.
How Do You Check Your Core Web Vitals?
Use two free Google tools. PageSpeed Insights checks one page at a time. The Core Web Vitals report in Search Console checks your whole site.
PageSpeed Insights: one page, two kinds of data
Paste a URL into PageSpeed Insights and you get two very different reports on the same screen.
The top section is field data from real Chrome users over the previous 28 days. This is the Core Web Vitals assessment, and it is what Google uses. The page passes only if the 75th percentile of all three metrics is good.
The section below it is the performance score. That number comes from a single Lighthouse test in a simulated setup. On mobile, Google simulates a mid-tier phone on a mobile network. It is great for finding problems, but it is one test, not your real visitors.
Why a 90+ score can still fail the assessment
This confuses almost everyone who runs a PageSpeed test. The score and the assessment measure different things. The lab test loads the page once and never clicks anything, so it cannot see a slow chat widget that freezes the page when a real buyer opens a dropdown. It also runs on Google's simulated network, while your buyers may be on hotel Wi-Fi or an older laptop.
So if the score is green and the assessment says failed, believe the assessment. Real visitors are having a slower experience than the test shows.
Search Console: the whole site, grouped
The Core Web Vitals report groups pages with a similar experience, so all your blog posts or all your solution pages tend to sit together. Each group gets a Poor, Need improvement or Good status for mobile and desktop. The group takes the status of its worst metric.

Why Do Most B2B SaaS Sites Fail Core Web Vitals?
B2B SaaS websites usually fail because of the marketing stack, not the design. Every tool brings its own JavaScript, often loads on every page, and often runs before the visitor has done anything.
Google's own Lighthouse audit flags this directly. It checks for heavy third-party code and tells you to load embeds like live chat only when someone needs them.
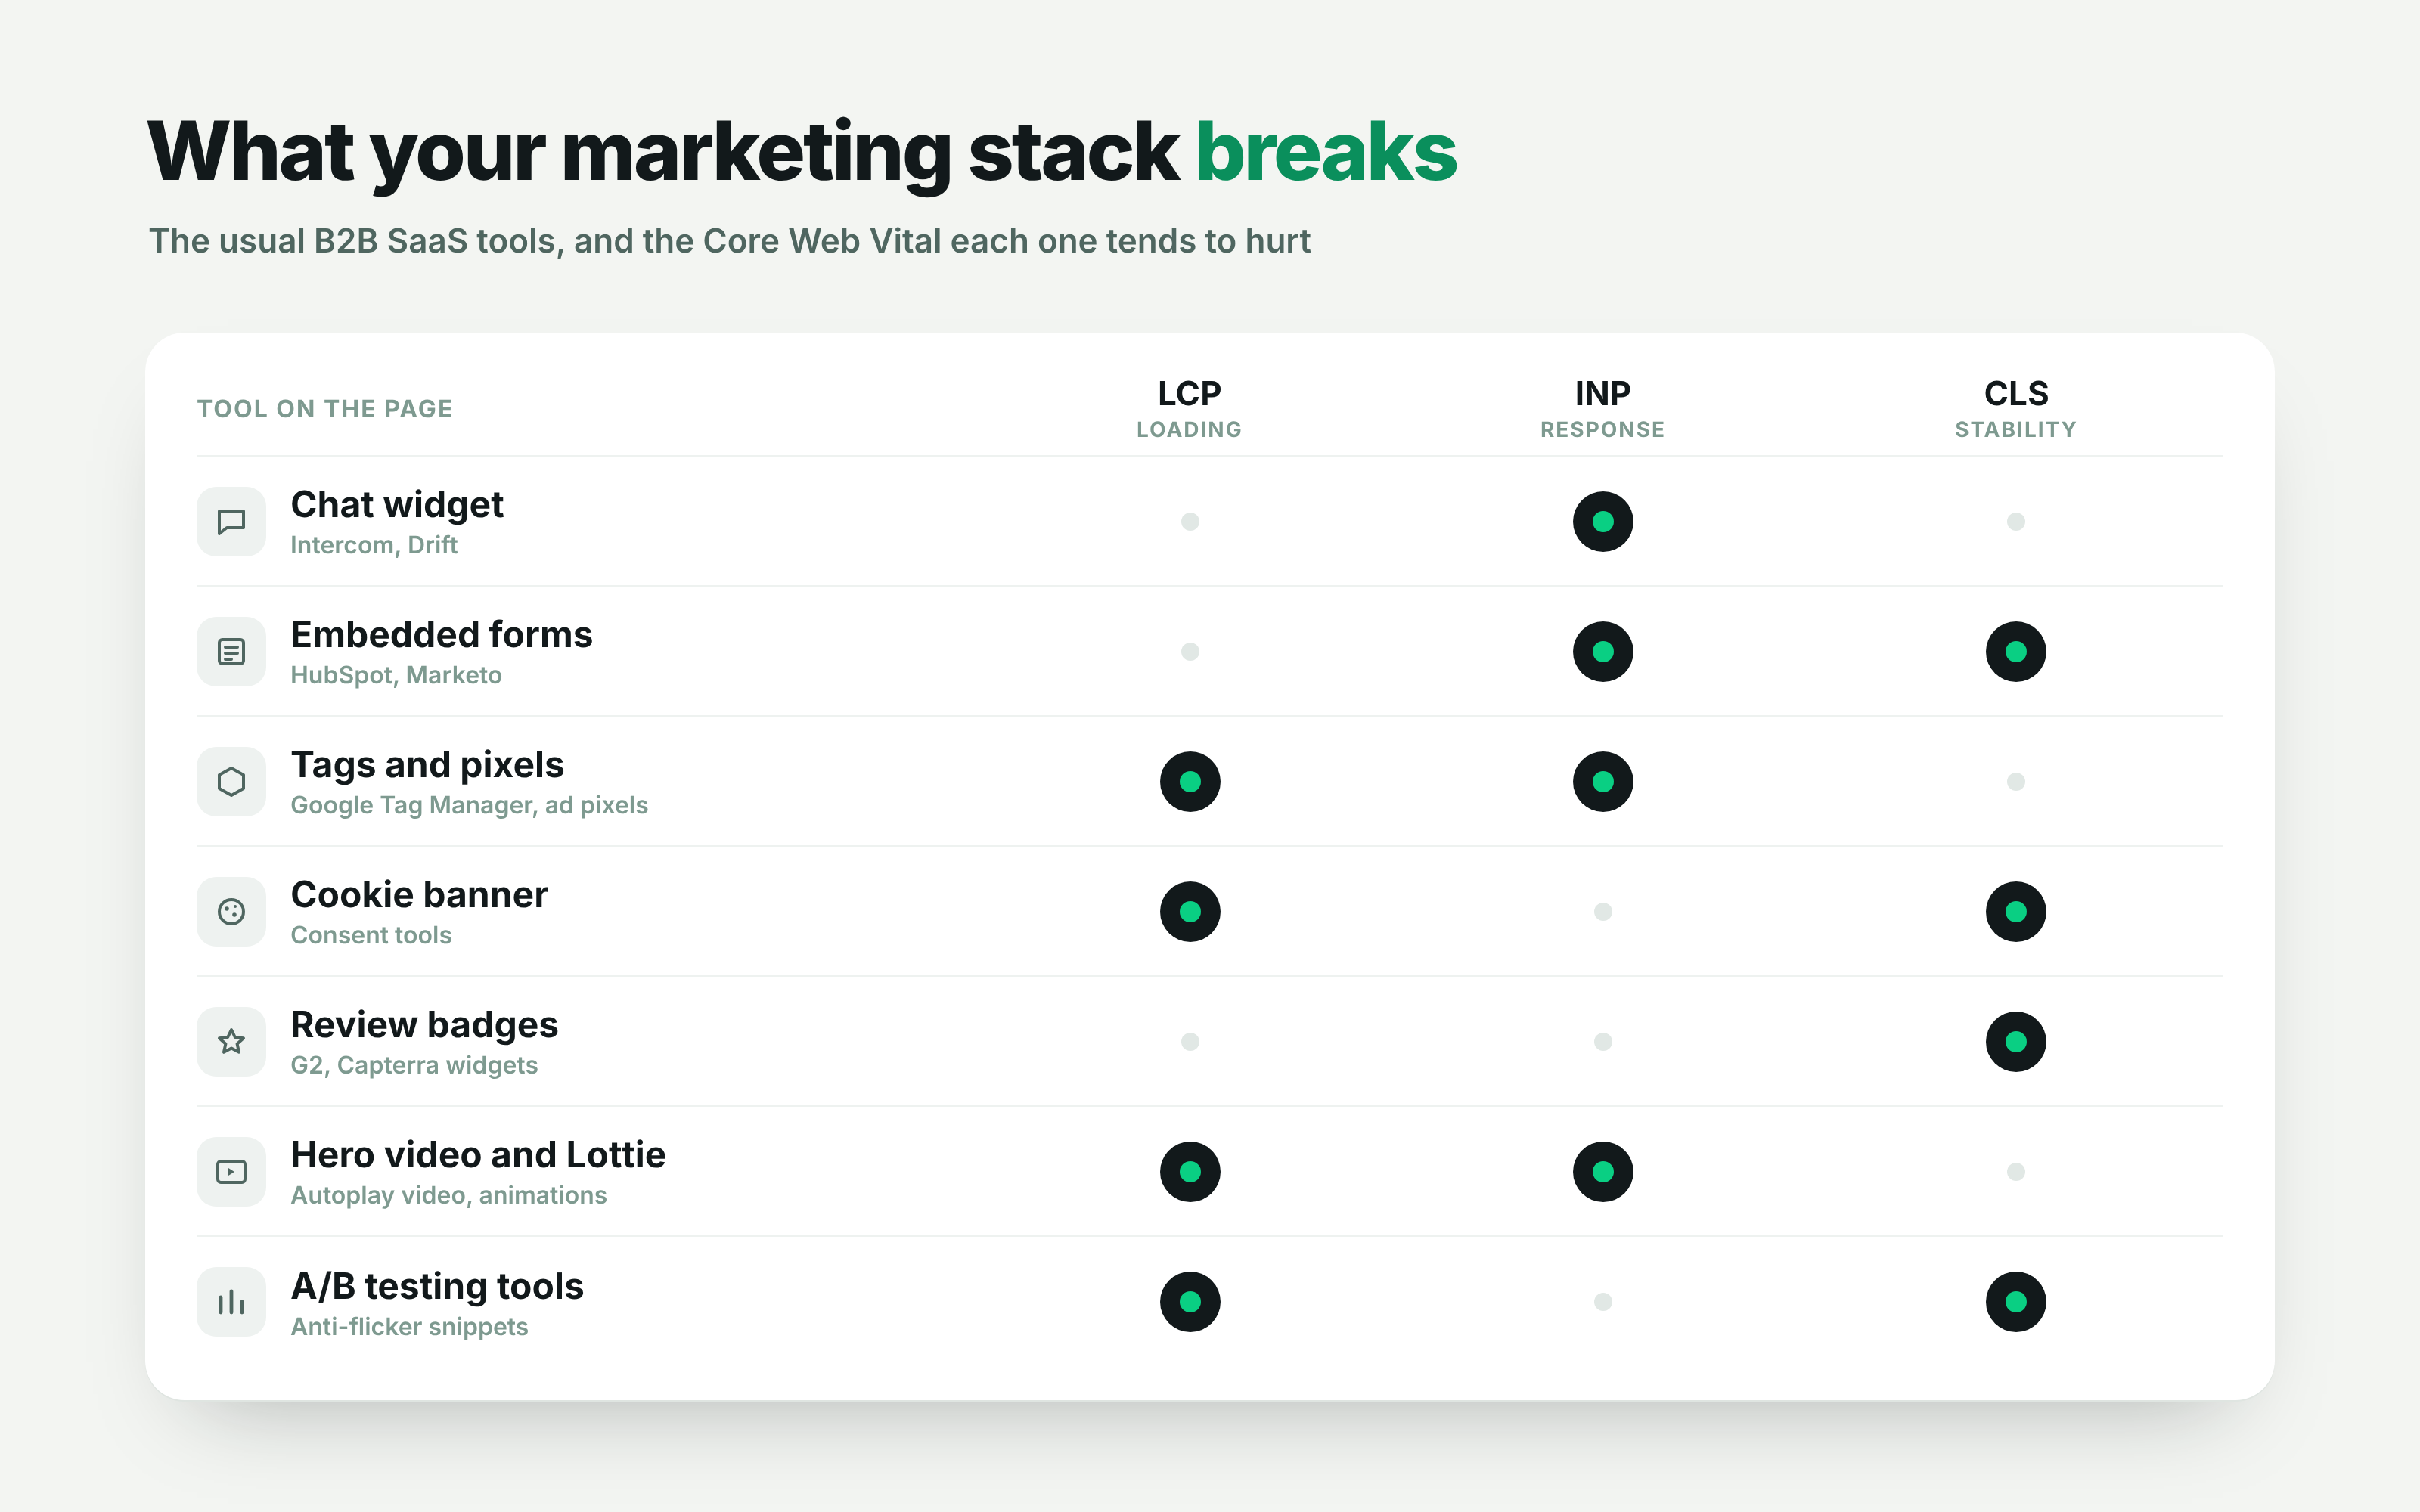
Here is how the usual B2B SaaS tools break each metric, and what to do about each one:
| Tool on the page | Metric it usually hurts | How to fix it |
|---|---|---|
| Chat widget (Intercom, Drift) | INP | Show a lightweight look-alike button and load the real widget only when someone clicks it |
| Embedded forms (HubSpot, Marketo) | INP and CLS | Reserve the form's height, and load it when it scrolls into view instead of on page load |
| Tag Manager tags and ad pixels | LCP and INP | Remove dead tags and fire non-essential ones after the page has loaded |
| Cookie consent banner | CLS, and LCP on mobile | Show it as an overlay or sticky footer, and load its script directly in the HTML |
| G2 and review badges | CLS | Give the badge a fixed width and height, or use a static badge image |
| Hero video and Lottie animations | LCP and INP | Add a light poster image, compress the video and load Lottie after the page renders |
| A/B testing tools | LCP and CLS | Avoid anti-flicker snippets that hide the page, and only run tests on the pages being tested |
None of these tools has to go. Most of the time, the fix is to change when a tool loads and how much space it takes, not whether you use it.
It is worth the effort. In a 50/50 A/B test on a Vodafone landing page, a 31% improvement in LCP led to 8% more sales and a 15% higher lead-to-visit rate. For a B2B site, leads are the number that counts.
We see the same thing on our own projects. When we rebuilt PuppyDog's website, page load speed improved and lead conversions went up 30%. On TripleDart's rebuild, fast page speed across the whole site was part of the brief from day one, next to a modular CMS the team could grow into.
How to Make Your Page Load Faster (LCP)
LCP is the time it takes for the biggest thing above the fold to show up. On a B2B SaaS homepage that is usually the hero image, the hero video or the headline. To improve LCP, make that one element arrive first.
Load the hero image first
Google's guidance is clear: "Never lazy-load your LCP image". Give the hero image fetchpriority="high" so the browser grabs it before anything else. Only about 17% of mobile pages with an LCP image do this today, according to the Web Almanac, so it is an easy win. Use it on one or two images at most, or it stops helping.
Make the hero file smaller
Export hero images as WebP or AVIF, and serve a smaller version to phones. A 3,000 pixel wide image on a 400 pixel wide screen is wasted download time.
Give hero videos a poster
For video, Google counts the poster image or the first frame, whichever shows first. So add a light poster image, compress the video and keep it short. Background videos that autoplay full screen are one of the most common LCP problems on SaaS homepages.
Stop fonts and scripts from blocking the page
Set font-display: swap on your web fonts, so the headline shows in a fallback font while the brand font loads. Then check the head of your page for scripts. Google says it is "almost never necessary to add synchronous scripts" there. Move them to defer or async.
Use a CDN for faster first bytes
A CDN serves your pages from a server close to the visitor, which cuts the time before anything starts loading. Most modern platforms like Webflow, Framer and Vercel include one. A CDN helps LCP a lot, but it does very little for INP, because INP is about what happens in the browser after the page loads.
If your current platform makes these fixes hard, the platform itself may be the problem. Some teams move their marketing site to a framework that ships less JavaScript by default.

How to Make Your Page Respond Faster to Clicks (INP)
INP measures how long the page takes to visibly respond after a click, tap or key press. On B2B sites, bad INP almost always comes from JavaScript that is busy at the moment a buyer tries to do something, like opening the pricing toggle or typing into a demo form.
Load the chat widget behind a click
This is the biggest single fix on most SaaS sites. Instead of loading Intercom or Drift on every page, show a static button that looks like the chat bubble. The real widget loads only when someone clicks it. Google calls this a facade and names live chat tools like Intercom, Drift and Help Scout as good candidates. For React sites, the open source react-live-chat-loader library does this for you.
There is one trade-off. Proactive chat messages will not pop up until the real widget loads, so decide which pages truly need them, like pricing, and keep the full widget there.
Defer everything the visitor does not need yet
Scroll tracking, heatmaps, session recording and retargeting pixels do not need to run in the first second. In Google Tag Manager, move non-essential tags from the Page View trigger to Window Loaded, and delete tags for tools you stopped paying for. Most B2B containers we open have a few.
Fix heavy menus, dropdowns and multi-step forms
Mega menus with hundreds of links, pricing calculators and long demo forms can all freeze the page on click. Google's INP guide recommends breaking long tasks into smaller ones and keeping the DOM small, because "When a page's DOM is small, rendering work usually finishes quickly."
How to measure INP
INP needs real clicks, so the lab score cannot show it fully. Check field data in PageSpeed Insights and Search Console first. To find the slow interaction, open Chrome DevTools, record in the Performance panel and click through the page like a buyer would. For ongoing tracking, Google's web-vitals JavaScript library can send real INP numbers to your analytics.
How to Stop Your Page From Jumping Around (CLS)
CLS measures how much content jumps around while the page loads. To improve your CLS score, reserve space for anything that loads late, so it fills a gap instead of pushing content down.
Set width and height on images and videos
Every image, video and iframe needs a width and height, or a CSS aspect ratio. That way the browser saves the right amount of space before the file arrives.
Reserve space for forms, badges and embeds
HubSpot forms, G2 badges and calendar embeds load after the page, then suddenly appear. Wrap each one in a box with a fixed minimum height that matches its final size. If the badge never changes, swap the live widget for a static image that links to your review page.
Do not push content down with banners
Google calls cookie notices "a very common source of layout shifts". Show your cookie banner, announcement bar and promo strips as an overlay or a sticky footer, so they sit on top of the page instead of shoving everything down. Google also recommends loading the consent script directly in the HTML, not through Tag Manager.
Match your fallback font
When a web font swaps in and has different spacing from the fallback, headlines can reflow and push content around. Pick a fallback font with similar spacing, and preload the font your hero headline uses.
Free website audit
How does your site score on technical health?
Get a scored breakdown of your positioning, proof, conversion paths and technical health. Results in about a minute.
85/100
Overall score
How to Pass the Core Web Vitals Assessment, and How Long It Takes
You pass when the 75th percentile of real visits is good for LCP, INP and CLS over the last 28 days. Because that window rolls forward one day at a time, a fix you ship today takes up to four weeks to show fully.
Here is how to get there without guessing:
- Fix the worst template first. Pick the Search Console URL group with the most Poor pages and fix the shared layout or component, not one page.
- Check mobile and desktop separately. Search Console scores them on their own, and most B2B sites fail on mobile first.
- Click Validate Fix. In the Core Web Vitals report, open the issue and start validation. Google then tracks it over a 28-day window. It does not ask Google to recrawl your site, it only watches the field data.
- Keep checking PageSpeed field data. The 28-day numbers move a little each day, so you can see the trend before validation finishes.
One more detail. If a page does not get enough traffic for INP data, PageSpeed Insights judges it on LCP and CLS alone. If it does not have enough data for LCP or CLS, it cannot be assessed at all.
Once you pass, the work is keeping it that way, because every new script or embed can undo it.
How to Stay Fast After a Website Redesign
Make Core Web Vitals part of launch QA, not a cleanup job after launch. Redesigns tend to add a new hero animation, new embeds and new scripts all at once, which is exactly when sites fall out of the green.
Set a budget for every template
Before design starts, agree on targets for each page template, like the homepage, solution pages, blog posts and demo page. Then design within them. A full-screen autoplay video on the homepage is a choice with a cost, and it is easier to make that call in Figma than after launch.
Test before every release
Run PageSpeed Insights on staging for each template, on mobile, before anything goes live. Lab scores cannot replace field data, but they catch big problems like a new 4 MB hero image or a blocking script in the head.
Give one person the keys to Tag Manager
Most slow sites get slow one tag at a time. Ask that every new script or embed goes through one owner who checks what it costs before it ships.
Core Web Vitals Launch Checklist
- Hero image compressed, not lazy-loaded and set to high priority
- Chat widget loads on click, not on page load
- Forms, badges and embeds sit in boxes with reserved height
- Cookie banner shows as an overlay or sticky footer
- Tag Manager cleaned up, with non-essential tags on Window Loaded
- Every template tested on mobile in PageSpeed Insights before launch
- Search Console Core Web Vitals report reviewed every month
This is how we approached ZingHR's website. ZingHR is a global enterprise HRMS used by 1000+ companies, and the brief included Core Web Vitals optimization across every template, a full SEO migration and mobile-first layouts. The new site loads faster, ranks the same or better, and the marketing team can ship new pages without waiting on developers.
Speed is something clients notice too. After we handled Wayground's rebrand and enterprise website migration, Connor Pierson, VP Marketing at Wayground, said: "The new site feels faster, cleaner, and truly reflects our brand."
Most Speed Problems Come From Your Tools, Not Your Code
Improving Core Web Vitals on a B2B SaaS website is rarely about rewriting the whole site. It is about the handful of tools that load on every page: the chat widget, the forms, the tags, the banner, the badges and the hero video. Change when they load and how much space they take, and most sites move into the green.
At Flowtrix, we build that discipline into the websites we design and develop, check it before every launch, and keep it in check through ongoing website support. With 100+ companies and 150+ websites behind us, we have seen most of the ways a marketing stack can slow a site down, and how to fix them without losing the tools your team relies on.
Flowtrix has worked with 100+ B2B, SaaS and AI companies. Here are a few rebuilds where speed was part of the brief.

22+ pages rebuilt in 4 weeks, with Core Web Vitals optimization across every template for a global HRMS.

8+ pages in 4 weeks, with fast page speed across the site and content updates 10x faster.

40% more visitor engagement, 30% more lead conversions and faster page loads for an AI video platform.

20+ pages in 5 weeks, with content updates 10x faster and an increase in conversions.
FAQ's
Quick answers to the questions B2B teams ask most when they start fixing Core Web Vitals.